As I have written on my past posts, supply chain / logistics companies are one of the wells of data and most of them are not aware of it.
For this post, I will scratch some parts of data cleaning and apply some descriptive analysis on the data I have found in Kaggle.
Here are the usual steps I am taking in cleaning the data.
As practised, these are the main libraries that I usually use in Python and let’s import these now.
import pandas as pd
import numpy as np
import matplotlib.pyplot as plt
import seaborn as sns
Now, let’s call in my downloaded dataset titled: DataCoSupplyChainDataset.csv. It is very important to know too the description of every column name we have in the csv and it is very helpful that we found a dataset that also has this feature.
df = pd.read_csv('DataCoSupplyChainDataset.csv')
info = pd.read_csv('DescriptionDataCoSupplyChain.csv')
pd.set_option('max_colwidth', 1)
info
Have you noticed what is wrong on the datatype on above column? Shipping date (DateOrders) is in object. Let’s convert it to a proper data type.
df['shipping date (DateOrders)'] = pd.to_datetime(df['shipping date (DateOrders)'], format='%m/%d/%Y %H:%M')
df['order date (DateOrders)'] = pd.to_datetime(df['shipping date (DateOrders)'], format='%m/%d/%Y %H:%M')
df.info()
Let’s further simplify this data.
If you will check the values on each row, you will find that there are somewhat duplicates of columns. To see what other columns we need to drop, let’s check what columns consist equal values.
df['Customer Id'].equals(df['Order Customer Id'])
df['Benefit per order'].equals(df['Order Profit Per Order'])
df['Order Item Cardprod Id'].equals(df['Product Card Id'])
Drop all sensitive and duplicate/redundant variables to clean our data.
Using the above list of variables and describe function, here are the questions that may a supply chain want to be known.
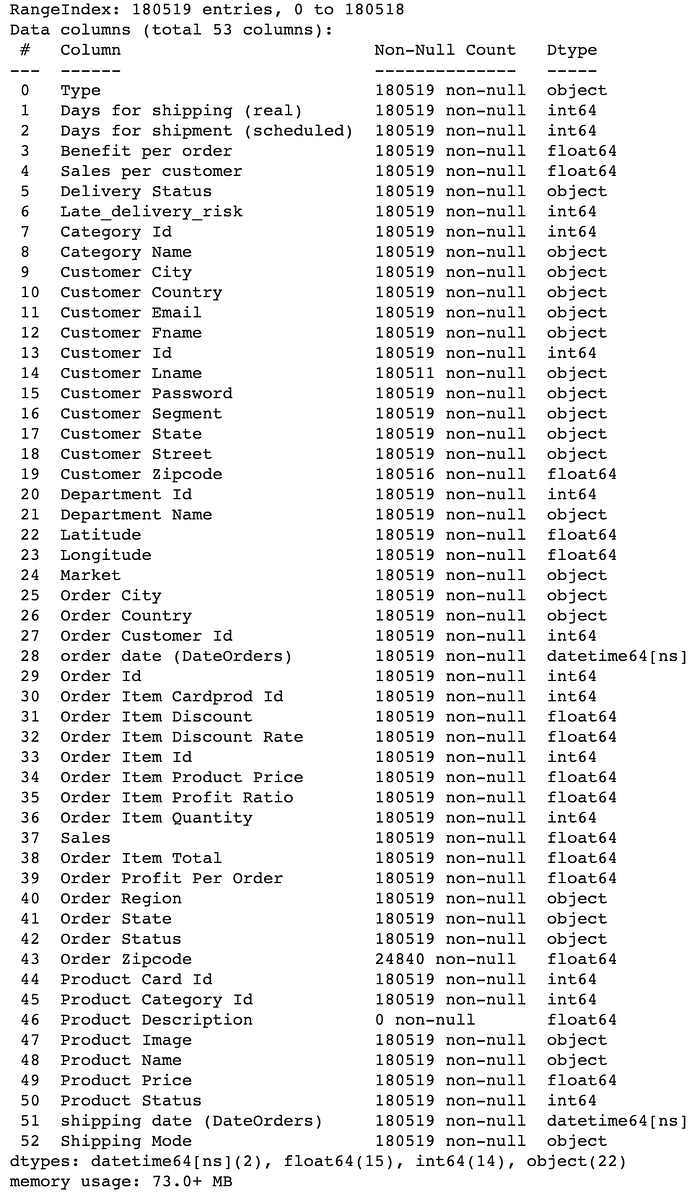
1. What type of payment that will be likely to be fraud? From what country? What product?
fraud=df[df['Order Status']=='SUSPECTED_FRAUD']
fraud_payment=fraud['Type'].value_counts().nlargest().plot.bar(figsize=(20,8), title="Payment Type With Suspected Fraud Cases")fraud_ordercountry=fraud['Order Country'].value_counts().nlargest().sort_values(ascending=False).plot.bar(figsize=(20,8), title="Top 5 Countries With Suspected Fraud Case")fraud_ordercountry=fraud['Product Name'].value_counts().nlargest().sort_values(ascending=True).plot.barh(figsize=(20,8), title="Top 5 Products With Suspected Fraud Case"
2. What year has the most oder shipment from the state of Illinois?
df['year'] = pd.DatetimeIndex(df['order date (DateOrders)']).year
IL=df[df['Customer State']=='IL']
IL['year'].value_counts().plot.bar(figsize=(20,8), title="Illinois Record of Shipments")
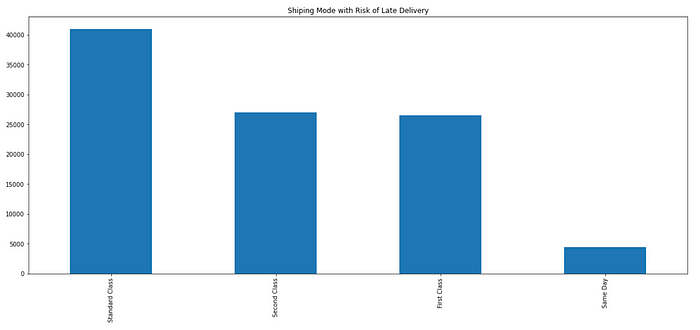
3. What shipping mode and region that has a higher delivery risk?
LATE=df[df['Delivery Status'] == 'Late delivery']
LATE['Shipping Mode'].value_counts().plot.bar(figsize=(20,8), title="Shiping Mode with Risk of Late Delivery")
I think I started to follow She Loves Data’s Facebook page when I have this curiosity in blockchain world. Basing on their non-profit social enterprise name, of course they were formed to uplift women and be a contributor in the world of data/technology.
So why I am blogging about She Loves Data? 2nd of July 2021, I signed up for one of their free workshops titled SheLovesData : Dashboard Foundations. The workshop has four modules and runs into a month of session. As what I have said on my previous posts, I am a newbie in this world of data and that is the reason I am so enthusiastic in learning and picking-up some of the brains of experts. With a partnership with TIBCO and SMU (Singapore Management University) the learners received a free 1 year-license to TIBCO Spotfire® subscription worth US$1250.
Oh, wow! TIBCO! If you are an F1 fan you will definitely know that Mercedes-AMG Petronas uses TIBCO for analysing their data.
Let’s dig in to what I have learned: Module 1 : The first week, of course is still a friendly week. Justin (our instructor) walked us through with the dashboard. We were immediately familiarised with Spotfire’s markings and filters. Basically, we explored the Spotfire dashboard as an end-user. It is only get-to-know week and our first assignment is to upload a photo card and state 2 facts and a lie about us.
Module 2: The agenda for that week is about Business and Analytical Questions and what are the uses of different charts. TICBO helps with Descriptive Analytics.
Module 3: Cleaning and visualisation. DATA: Deduce, Acquire, Tidy, Augment — The Development Data Process. That week’s exam is pretty challenging.
Module 4: We were taught how to build interactivity, bookmarks and stories in the dashboard. Of course, this is the finals and we were given 2 weeks to complete our last homework for this workshop.
The workshop will tickle your brain to build a great dashboard with simplicity and accuracy. Based on my experience, She Loves Data workshop truly is worth the time and TIBCO Spotfire is quite an intuitive tool even for newbies. What’s next?
Since I have the free Spotfire for a year, I will use it and be part of my portfolio :)
Looking forward on She Loves Data next workshop for specialists! Yey!
I am bit skeptical when Abbey bought me an Apple Watch. It seems that I am its prisoner. Imagine, wearing a watch until you are in sleep? But when Health Promotion Board introduced LumiHealth, well they got me there. Haha! Okay lah! Will wear it FOR VOUCHERS.
From 2020 October I already redeemed $310 and still have $29.43 in my wallet. Not bad right? Keeping me healthy physically and mentally while earning ka-chingss!
So how it works? First of all, you are not alone in this, Lu (the intergalactic explorer) will join you and can only move and earn points if you hit your goals. LumiPoints help Lu move forward through each chapter of the game and when Lu reaches milestone then you can earn coins that can be redeemed in HPB vouchers. Below are some challenges with corresponding LumiPoints.
LumiHealth is perfect when pandemic hit. The goals motivate me to move to at least have a 15-minute exercise daily, choose vegetables than meat, monitor my sugar intake, most specifically I am giving myself a 5-minute relaxation through mindful breathing. Can easily monitor that I am sitting for too long.
Through the “Answer This” section I am informed about the health screenings, vaccinations that I should have on my age.
LumiHealth is indeed helpful to track our lifestyle that really affects our health. We are truly grateful for this program.