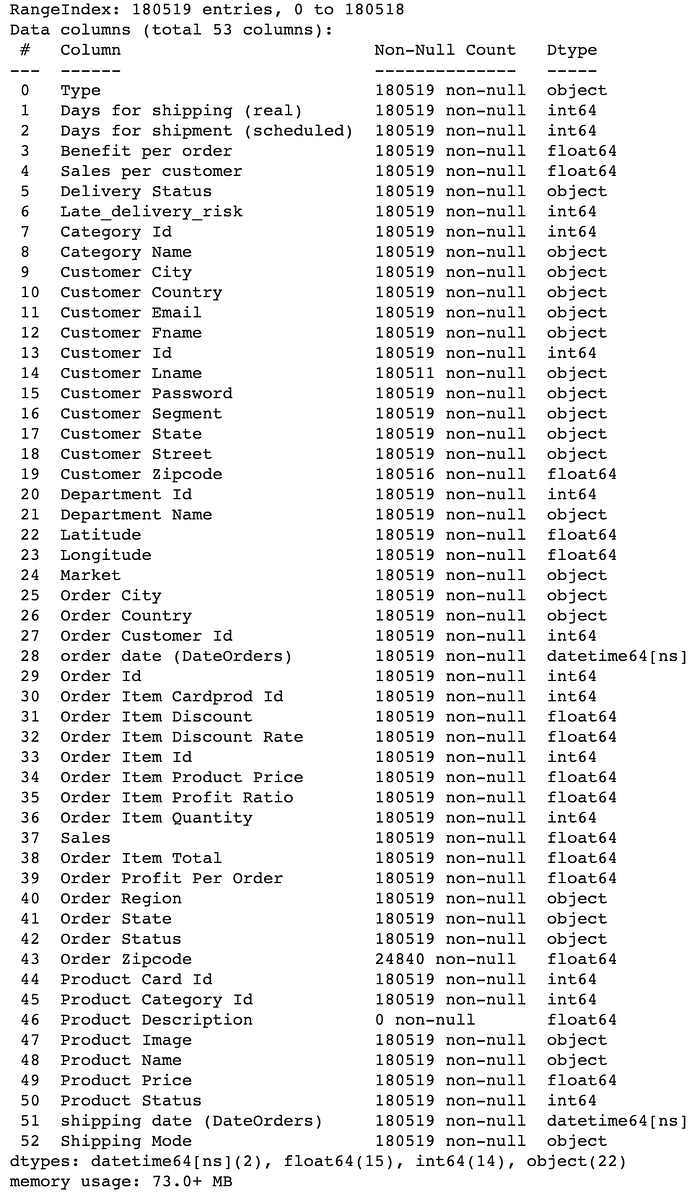
As I have written on my past posts, supply chain / logistics companies are one of the wells of data and most of them are not aware of it.
For this post, I will scratch some parts of data cleaning and apply some descriptive analysis on the data I have found in Kaggle.
Here are the usual steps I am taking in cleaning the data.
As practised, these are the main libraries that I usually use in Python and let’s import these now.
import pandas as pd
import numpy as np
import matplotlib.pyplot as plt
import seaborn as sns
Now, let’s call in my downloaded dataset titled: DataCoSupplyChainDataset.csv. It is very important to know too the description of every column name we have in the csv and it is very helpful that we found a dataset that also has this feature.
df = pd.read_csv('DataCoSupplyChainDataset.csv')
info = pd.read_csv('DescriptionDataCoSupplyChain.csv')
pd.set_option('max_colwidth', 1)
info
Have you noticed what is wrong on the datatype on above column? Shipping date (DateOrders) is in object. Let’s convert it to a proper data type.
df['shipping date (DateOrders)'] = pd.to_datetime(df['shipping date (DateOrders)'], format='%m/%d/%Y %H:%M')
df['order date (DateOrders)'] = pd.to_datetime(df['shipping date (DateOrders)'], format='%m/%d/%Y %H:%M')
df.info()
Let’s further simplify this data.
If you will check the values on each row, you will find that there are somewhat duplicates of columns. To see what other columns we need to drop, let’s check what columns consist equal values.
df['Customer Id'].equals(df['Order Customer Id'])
df['Benefit per order'].equals(df['Order Profit Per Order'])
df['Order Item Cardprod Id'].equals(df['Product Card Id'])
Drop all sensitive and duplicate/redundant variables to clean our data.
Using the above list of variables and describe function, here are the questions that may a supply chain want to be known.
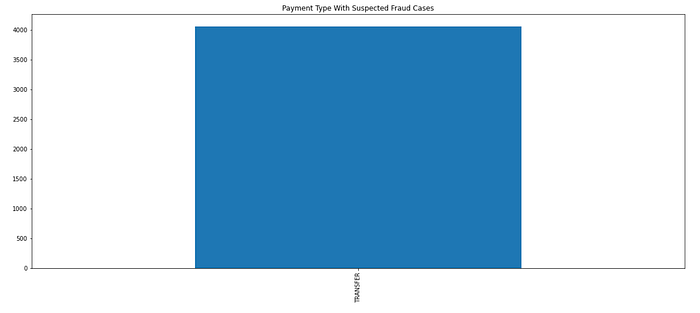
1. What type of payment that will be likely to be fraud? From what country? What product?
fraud=df[df['Order Status']=='SUSPECTED_FRAUD']
fraud_payment=fraud['Type'].value_counts().nlargest().plot.bar(figsize=(20,8), title="Payment Type With Suspected Fraud Cases")fraud_ordercountry=fraud['Order Country'].value_counts().nlargest().sort_values(ascending=False).plot.bar(figsize=(20,8), title="Top 5 Countries With Suspected Fraud Case")fraud_ordercountry=fraud['Product Name'].value_counts().nlargest().sort_values(ascending=True).plot.barh(figsize=(20,8), title="Top 5 Products With Suspected Fraud Case"
2. What year has the most oder shipment from the state of Illinois?
df['year'] = pd.DatetimeIndex(df['order date (DateOrders)']).year
IL=df[df['Customer State']=='IL']
IL['year'].value_counts().plot.bar(figsize=(20,8), title="Illinois Record of Shipments")
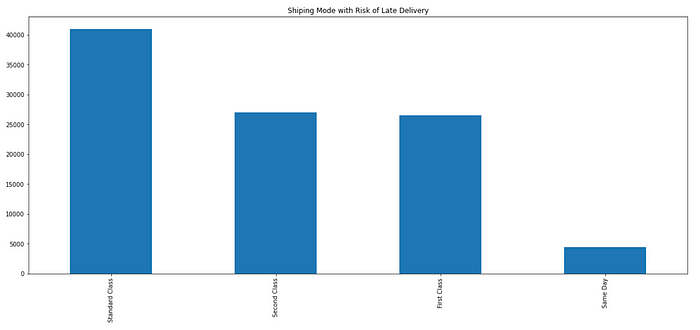
3. What shipping mode and region that has a higher delivery risk?
LATE=df[df['Delivery Status'] == 'Late delivery']
LATE['Shipping Mode'].value_counts().plot.bar(figsize=(20,8), title="Shiping Mode with Risk of Late Delivery")


No comments:
Post a Comment