Monday, February 6, 2023

Evolution of Logistics Analyst

Antoine-Henri, Baron Jomini a French officer defined logistics (1838; Summary of the Art of War, 1868) as “the practical art of moving armies,” The word clearly describes the movement of services of people and supplies to provide requirements in winning a war. Now, the word logistics is widely use by companies in defining their process of managing and planning goods and resources to serve its purpose.

Evolution of Logistics Analyst by Wilma Lapuz


The Progressing Role in Logistics:
1. Logistics Customer Service — this first line of defence in logistics. They are the one handling calls and emails. This role not only supports import/export/local department but also ad hoc jobs required by accounts or sales. They are the ones also responsible in general filing or other administrative duties.

2. Logistics Officer — this position ensures to support international/local order fulfilment and deliveries in a timely and efficiently manner. Sounds easy? Think again. They are the ones responsible in stock inventory and data entry, sometimes not only their own companies but some of the clients too.

3.Logistics Analyst — due to automation and rapid change of technology, you may notice some of the online job postings of companies are combining the two above roles and adding up analytics expertise on it.


Company Benefits Having a Logistics Analyst
Data is the New GOLD. In that case, logistics companies even freight forwarding businesses are seating unknowingly in a pot of gold.

So how logistics or freight forwarding companies can take advantage and stay afloat in the Fourth Industrial Revolution? If you will observe companies like DHL or Bollore they are actively hiring analysts now. Why? Because companies do not want to run their companies through gut-feel or crystal ball. Data companies like Google proved that many business will be more productive if decisions will be made using data.

Imagine, using the historical data of your clients you can anticipate the volume of materials they needed, from which supplier and what mode of transport. You can provide them quotations even if they are not asking. Wink-wink! That’s a customised customer service.

What else? Do you know why you keep on losing in bidding to get the project? Do you remember why are you winning? In aggregating your data you can anticipate the moves of your competitors.

Remember building relationship with your client and suddenly no more business calls from them? As a salesperson, will you meet them for lunch just to know what went wrong? Well, have you taken care of the KPIs of their stakeholder and provided customer experience? Remember customer experience now is valuable as getting your service on a lower price.

Of course, logistics analysts monitors not only the KPIs but also the procedures and practices to identify developments in planning and execution.


Do you need a Logistics Analyst even you are a Small/Local Company?
I want you to answer this question, are you competing with multinational company by giving quotations to your perspective importer/exporter? How can you compete if they their logistics analysts research the expectations of the clients in a certain project? Remember, some companies are willing to pay the price as long as you can meet their deadlines and KPIs.

Another thing to think of.. do you know that many start-ups that’s armed with data are now entering the logistics industry? They are providing quotes more quickly and offers an agile bid on clients. You know that in logistics/freight forwarding time is of the essence.

The line of difference in Logistics/Freight Forwarding industry is getting thinner and thinner. Competition is evolving fundamentally and companies should always examine whether they have the capacity and capabilities to change and compete.

Will you emerge and develop solutions to move forward and upward or you will just stay where you are because.. well I know, it is tough to change.

Sunday, February 5, 2023

UC Davis: SQL for Data Science - Profiling and Analyzing the Yelp Dataset

Whats is Yelp? It aims to provide a one-stop platform for local businesses. Like other social media, it creates community. And that community discovers, transacts, and reviews local businesses around them.

For this post we will use Yelp dataset and will formulate ideas for analysis.

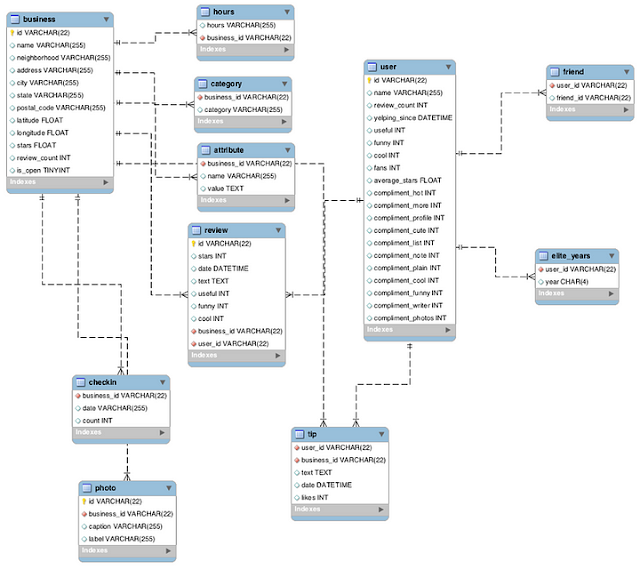
First, we need to explore the dataset. Below is the structure data in table form.

The Yelp Dataset
The Yelp Dataset


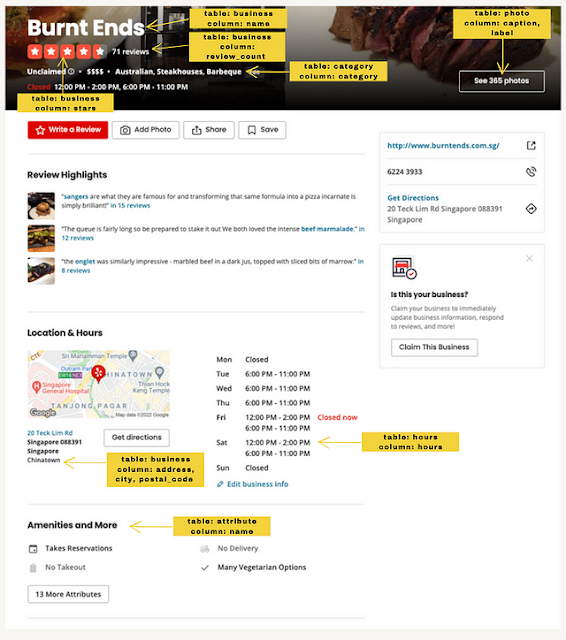
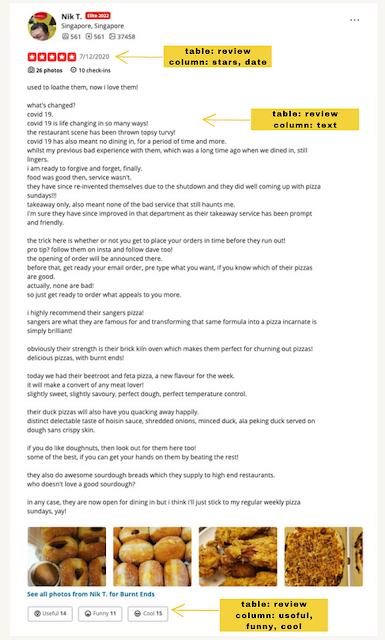
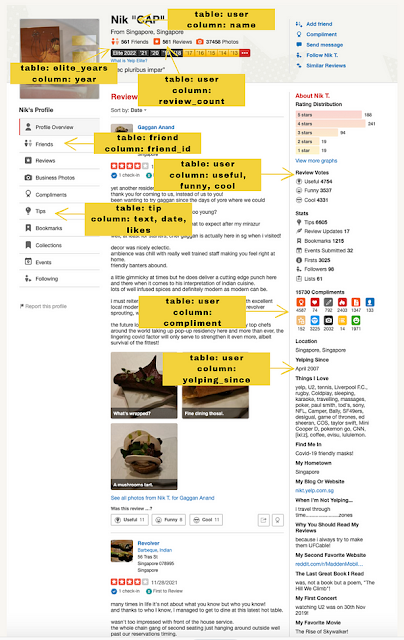
And for me to understand the above data and the entirety of its contents, I have visited the YELP website and marked the table names and column names against its pages.

The Yelp Dataset - Business

The Yelp Dataset - Review

The Yelp Dataset - User Page


Armed with understanding, profiling and establishing relationship among multiple tables, you can now look onto subjects that can be useful for different stakeholders.

Some of the business questions lingered on my mind upon seeing the above data were:
  • What cities could be the best choice in setting up a business?
  • Are there weight on the reviews coming from elite year users?
  • What are the main words used in text reviews for sentiment analysis?
  • Finding the effect of review_count and check-in on the life of a business.

I focused on the latter due to the limitations of SQLite.
SELECT business.name
, business.stars
, business.review_count
, business.is_open
, SUM(checkin.count)
FROM business INNER JOIN checkin ON business.id =checkin.business_id
GROUP BY business.name
ORDER BY SUM(checkin.count) DESC


Two (2) tables were needed to get the answer for the above analysis. I used INNER JOIN to avoid getting the ‘None’ value.

The below selected data will prove that even a company received only 1 star it is still open for business. That businesses that received highest checkin count do not necessarily have 5 stars and so on. Thus, this data means that there is no direct correlation on stars, review_count and checkin.

It would be good for YELP to indicate the current population for the neighbourhood on that business.

The Yelp Dataset — Correlation of Review Count, Checkin, and Stars


That’s all for now! Be curious y’all! Don’t forget to click the clap button! *wink-wink*

Saturday, February 4, 2023

Exploring Supply Chain Dataset

As I have written on my past posts, supply chain / logistics companies are one of the wells of data and most of them are not aware of it.

For this post, I will scratch some parts of data cleaning and apply some descriptive analysis on the data I have found in Kaggle.

Here are the usual steps I am taking in cleaning the data.

As practised, these are the main libraries that I usually use in Python and let’s import these now.
import pandas as pd
import numpy as np
import matplotlib.pyplot as plt
import seaborn as sns

Now, let’s call in my downloaded dataset titled: DataCoSupplyChainDataset.csv. It is very important to know too the description of every column name we have in the csv and it is very helpful that we found a dataset that also has this feature.
df = pd.read_csv('DataCoSupplyChainDataset.csv')
info = pd.read_csv('DescriptionDataCoSupplyChain.csv')
pd.set_option('max_colwidth', 1)
info


Now let’s explore our data.
pd.set_option('display.max_columns', None)
df.head()
df.info()
https://github.com/WilmaLapuz/Portfolio/blob/main/SUPPLYCHAIN.ipynb


Have you noticed what is wrong on the datatype on above column? Shipping date (DateOrders) is in object. Let’s convert it to a proper data type.
df['shipping date (DateOrders)'] = pd.to_datetime(df['shipping date (DateOrders)'], format='%m/%d/%Y %H:%M')
df['order date (DateOrders)'] = pd.to_datetime(df['shipping date (DateOrders)'], format='%m/%d/%Y %H:%M')
df.info()


Let’s further simplify this data.

If you will check the values on each row, you will find that there are somewhat duplicates of columns. To see what other columns we need to drop, let’s check what columns consist equal values.
df['Customer Id'].equals(df['Order Customer Id'])
df['Benefit per order'].equals(df['Order Profit Per Order'])
df['Order Item Cardprod Id'].equals(df['Product Card Id'])

Drop all sensitive and duplicate/redundant variables to clean our data.

df.drop([
'Benefit per order',
'Customer Email',
'Customer Password',
'Product Image',
'Order Zipcode',
'Product Description',
'Order Item Cardprod Id',
'Order Customer Id'
], axis = True, inplace = True)

df.head()


These are the few variables that caught my eyes:
  1. Type
  2. Late_delivery_risk
  3. Customer State
  4. Order Country
  5. Order Region
  6. Order Status
  7. Product Name
  8. Shipping Mode

Using the above list of variables and describe function, here are the questions that may a supply chain want to be known.

1. What type of payment that will be likely to be fraud? From what country? What product?
fraud=df[df['Order Status']=='SUSPECTED_FRAUD']
fraud_payment=fraud['Type'].value_counts().nlargest().plot.bar(figsize=(20,8), title="Payment Type With Suspected Fraud Cases")
fraud_ordercountry=fraud['Order Country'].value_counts().nlargest().sort_values(ascending=False).plot.bar(figsize=(20,8), title="Top 5 Countries With Suspected Fraud Case")fraud_ordercountry=fraud['Product Name'].value_counts().nlargest().sort_values(ascending=True).plot.barh(figsize=(20,8), title="Top 5 Products With Suspected Fraud Case"
https://github.com/WilmaLapuz/Portfolio/blob/main/SUPPLYCHAIN.ipynb

2. What year has the most oder shipment from the state of Illinois?
df['year'] = pd.DatetimeIndex(df['order date (DateOrders)']).year
IL=df[df['Customer State']=='IL']
IL['year'].value_counts().plot.bar(figsize=(20,8), title="Illinois Record of Shipments")

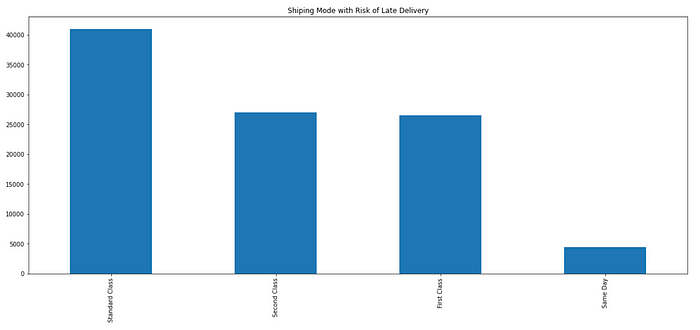
3. What shipping mode and region that has a higher delivery risk?
LATE=df[df['Delivery Status'] == 'Late delivery']
LATE['Shipping Mode'].value_counts().plot.bar(figsize=(20,8), title="Shiping Mode with Risk of Late Delivery")
https://github.com/WilmaLapuz/Portfolio/blob/main/SUPPLYCHAIN.ipynb

This is only the start of many things what we can uncover using this supply chain dataset. I will do my best to use this dataset for my other upcoming projects.

Get this gadget at facebook popup like box