CHAPTER 1 : INTRODUCTION
Background
The growing population of Philippines with regards to mobile phone usage as primary source of communication is a good sign of business for telecommunication companies but it comes with a massive competition not only with each other but also with the noise of other products.
Internet has pivoted many accustomed activities, and marketing is no exception. As more and more people are attached to their phones, companies develop a new era of advertising, the digital marketing. This study aims to solve the problems of marketing in the narrowing attention span of consumers and highlight the effectiveness of door-to-door marketing.
Smarta, a local telecommunications company, is considering to hire a marketing agency to do a door-to-door sampling caravan project to give out free prepaid SIM cards to households. The objective is to increase the subscriber base of the company while obtaining a net profit from this project by hoping that the free SIM card samples will eventually be activated in the future and revenue will flow from the activated SIMs.
Research Question
From the above background, the following question can be drawn the following main question.
- Is the door-to-door SIM card distribution effective to attract new customers?
Scope and Limitation
-The scope of this research is related to the business process proposal of sampling system given by the marketing agency to SMARTA.
-The study is limited to the population report published at the Philippine Statistics Authority website dated 2015.
CHAPTER 2 : LITERATURE REVIEW
Marketing and Its Growing Problem
Marketing refers to activities a company undertakes to promote the buying or selling of a product or service, (TWIN, 2020). Marketing evolves hand-in-hand with technology and thus produced digital marketing. But a problem arises on that, fierce competition on consumer attention (A new study in Nature Communications finds that our collective attention span is indeed narrowing, and that this effect occurs not only on social media but also across diverse domains including books, web searches, movie popularity, and more, (Technical University of Denmark, 2019)) and developing trust (Digital enables them to voice their concerns or dissatisfaction in an amplified way. In fact, we found that 40% of global consumers posted negative comments about an experience with a company via social media. Their digital distrust can easily influence thousands of potential customers to stay away (BENDER, BARTON, & MARQUE, 2017)).
Marketers Backtracked Towards Sampling
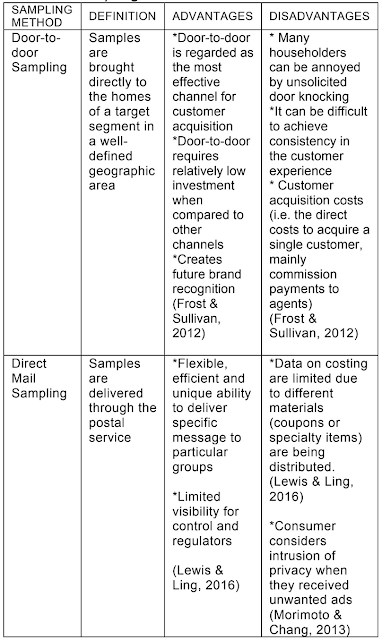
Marketers came up with different styles of product sampling and below are the two with direct access to household (University of Missouri, 2015):
Table 1: Product Sampling Method
 |
| Product Sampling Method |
Product sampling continues to rank among the most effective tactics in the history of marketing because of its ability to do what no other medium can. Put the product directly in the customer’s hands.
Improved Door-to-Door Sampling
As above table portrays, available data and results are limited for marketers to implement the direct mail sampling. It also leaves a negative impact on potential clients due to the feeling of intrusiveness. Thus on reports of DMA UK Ltd (2014), door-to-door sampling is an extremely effective and impactful method of reaching and communicating with your target audience — which is why some 80% of the UK’s top advertisers use the medium.
Gap Analysis
Aim to further explore the relationships and effects in implementing the two marketing style (Door-to-door Sampling and Direct Mail Sampling) in the same adequate sample household.
CHAPTER 3: PROPOSED RESEARCH DESIGN
Research Design
This research applied quantitative and qualitative methods. The quantitative method was used to meet a reasonable cost for marketing with a time bound study of 100 days. Qualitative method used to explore the pertinent data to their conceptual framework that quantitative data could not facilitate (Crick, 2020).
Population and Sample
The door-to-door caravan used a non-probability quota sampling that was conducted around the City of Taguig and nearby city with a distance not more than 10-Kilometer and with approximate travel period that is not more than one hour.
Instruments
The data for this door-to-door caravan were collected by giving a standardized form for recipients to affix their signature to prove the acceptance of the SIM card.
Data Gathering
The instrument of this door-to-door caravan was administered and personally collected by the samplers. The SIM card distribution took 100 days.
PROPOSED DATA ANALYSIS METHOD
Quantitative
In cross-sectional design, we will use the descriptive and categorical analysis to illustrate the mean and deviation, percentage and frequency. In this study, prescriptive analysis will be utilized to determine the next decision to be taken by SMARTA.
Qualitative
On qualitative data, content analysis will be used to analyse the data from the door-to-door caravan marketing sampling conducted by 10 samplers.
CHAPTER 4: IMPLEMENTATION
Proposed Sampling System by Marketing Agency
The marketing agency proposed a Php5,000,000.00 contract (SIM card exclude SIM card costs) for SMARTA’s 100 day SIM card distribution. The marketing agency proposes the below sampling system.
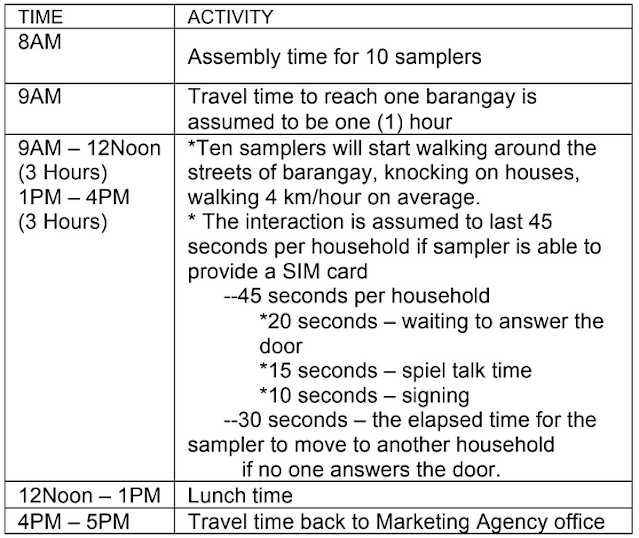
Table 2: Marketing Agency Proposed Activity
 |
| Marketing Agency Proposed Activity |
The above marketing agency’s proposed sampling system shows that the 10 samplers only have 6 hours per day to distribute SIM cards. Assuming that all the barangay that marketing agency will visit a population of 26,213 (average household size of 4 (Lungsod ng Makati, 2019)) that covers a lot area of 0.88km2 with approximately 5,698 of household like Barangay Bangkal of Makati (Lungsod ng Makati, 2018), samplers approximately 70.809 kilometers to cover per day.
Equation 1: Household Lot Length
Equation 2: Kilometers To Cover Per Barangay
In order to estimate the number of household that a sampler can visit in an hour, the marketing agency provided a 40km/hour as the velocity of the one sampler. Estimated of forty-five seconds spiel talk time (accepts/declines SIM card) and 30 seconds for household that do not answered the door was also provided by the marketing agency will total an average of 37.50 seconds. With the help Household Lot Length equation, the number of household per hour can be solved.
Equation 3: Number of Households Visited Per Minute
Equation 4: Walk Time Per Minute Per Household
Equation 5: Target Household Visits Per Hour
A target of sixty five (65) households visiting per hour with a six (6) working hours each for ten (10) samplers for one hundred days (100) days, there are 390,000 households could get in touch for the given sampling period.
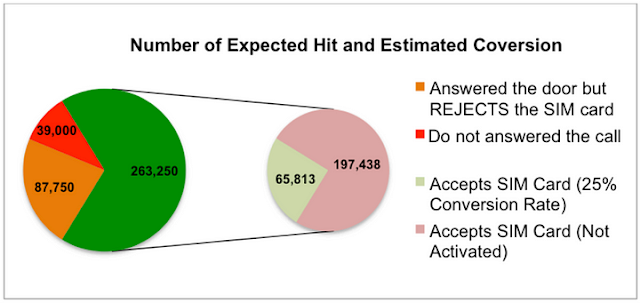
Below chart is the expected hit and estimated conversion by the marketing agency:
 |
| Number of Expected Hit and Estimated Conversion |
Exclusion of SIM card Php40.00 manufacture and Php50.00 credit with total cost of Php35,100,000.00, the marketing agency estimated an average return of revenue of Php13,162,600 yearly for SMARTA’s newly acquired customers.
SMARTA Implementation Plan
The objective of this SMARTA implementation plan is to increase the estimated new subscribers advised by the marketing agency. With the current situation, home-based learning was on effect to minimize and stop the spread of the virus. Unlike the marketing agency’s proposal, this plan targets consumers not only the close proximity barangays but students with demographics of 5 to 24 years that currently attending online school.
As one of the parents told (REUTERS, 2021) “Sometimes we change the SIM card to a different provider so he doesn’t have to study on the roof, but there’s rarely enough money to spare for that”. Consumers are now resulting to be more engaged on benefits offered by different telecommunication providers (Pew Research Center, 2019). Based on a study (Capistrano, 2013), the overall data shows that promotions and giveaways rated the highest level of involvement. This implies that generally speaking, mobile phone users exert more effort in learning about the promotions and giveaways being offered to them by the service providers more than the other service offerings. Thus, the SMARTA’s is on the right time to pursue door-to-door sampling caravan and target the students that are definitely at home.
The sampling will a benefit student and parents on budget and a contribution to the government for its campaign to promulgate online classes.
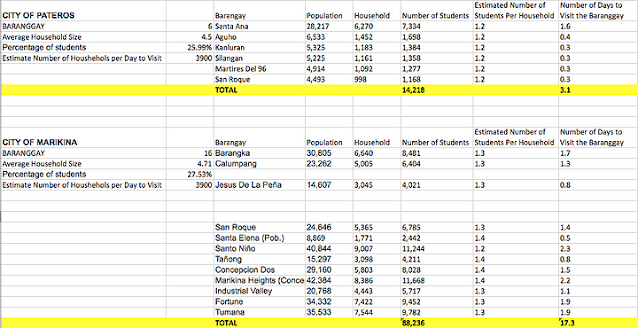
With the above socio-economic objective, the target barangays that has a 25% and above students on their population and the visit should not be per barangay per day but to visit the number households as reported from PSA (Philippine Statistics Authority, 2017). Below are the list of barangay and corresponding number of target students and days need to spend in a barangay given the rates from marketing agency.
The above barangays are projected to get in touch on a total of 502,190 students in 100 days. On such case, it is not needed to push outside of NCR for a door-to-door caravan.
If SMARTA pushes to reach 500,000 hits with a hit rate of 75% (answered the door) we will need 19 samplers to knock 740,741 doors in 100 days or 10 samplers conducting the door-to-door in 190 days.
Equation 6 : Household Visits
Equation 7: Household Visits Per Hour Per Sampler
Equation 8: Calculating How Many Samplers Needed for 100 Days
Equation 9: Calculate How Many Days Needed for 10 Samplers
Table 4: SMARTA Strategic Sampling with Cost
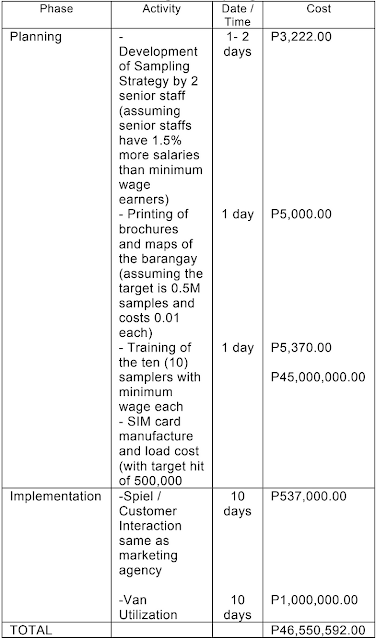 |
| Strategic Sampling with Cost |
To avoid these problems and yet reach the target hit of 500,000, this study strongly recommend that the SMARTA or marketing agency will based on the number of acceptance target number rather than the per day in to pursue this door-to-door sampling.
Clearly, with a 53% ROI (marketing agency 46%) it will be cost efficient for SMARTA to take this study on their own. Sensitive variables will as mentioned above will be fully under control.
CHAPTER 5: BIBLIOGRAPHY
1. Technical University of Denmark. (2019, April 15). Abundance of information narrows our collective attention span. Retrieved from ScienceDaily: www.sciencedaily.com/releases/2019/04/190415081959.htm
2. TWIN, A. (2020, Aug 17). BUSINESS ESSENTIALS. Retrieved from Investopedia: https://www.investopedia.com/terms/m/marketing.asp
3. BENDER, M., BARTON, R., & MARQUE, F. (2017). Trust in the Digital Age .ACCENTURE. ACCENTURE.
4. University of Missouri. (2015, April 8). Course Hero. Retrieved from Course Hero: https://www.coursehero.com/file/p6o95um/Door-to-door-sampling-a-type-of-sampling-in-which-samples-are-brought-directly/
5. Frost & Sullivan. (2012). Research into the Door-to- Door Sales Industry in Australia. Frost & Sullivan for the Australian Competition and Consumer Commission (ACCC).
6. Lewis, J., & Ling, P. (2016). “Gone Are the Days of Mass-media Marketing Plans and Short Term Customer Relationships”: Tobacco Industry Direct Mail and Database Marketing Strategies. Tobacco Control.
7. Morimoto, M., & Chang, S. (2013, Jul 01). Consumers’ Attitudes Toward Unsolicited Commercial E-mail and Postal Direct Mail Marketing Methods. Journal of Interactive Advertising .
8. DMA UK Ltd. (2014). Door drop guide.
9. Crick, J. M. (2020, March). Qualitative research in marketing: what can academics do better? Journal of Strategic Marketing .
10. Lungsod ng Makati. (2018). Barangays. Retrieved January 2021, from Makati Portal: https://www.makati.gov.ph/assets/uploads/staticmenu/docs/1579227221918.pdf
11. Lungsod ng Makati. (2019). Facts and Figures. Retrieved January 2021, from Makati Portal: https://www.makati.gov.ph/cms/content/facts%20and%20figures/3241
12. REUTERS. (2021, Jan 7). ASIA. Retrieved from AsiaONe: https://www.asiaone.com/asia/scaling-roofs-and-mountains-philippine-students-battle-take-online-classes
13. Pew Research Center. (2019, November 20). Internet and Technology. Retrieved from Pew Research Center: https://www.pewresearch.org/internet/2019/11/20/mobile-owners-what-they-struggle-to-do/
14. Capistrano, E. (2013). Investigating Product Involvement Issues for Mobile Phone Services: A Study of Filipino Mobile Phone Users. Philippine Management Review 2013 .
15. Philippine Statistics Authority. (2017, June 30). Philippine Population Surpassed the 100 Million Mark (Results from the 2015 Census of Population). Retrieved from Philippine Statistics Authority: https://psa.gov.ph/population-and-housing/statistical-tables
16. Marikina City. (n.d.). The Shoe Capital of the Philippines. Retrieved from Marikina City: https://www.marikina.gov.ph/Our-City.html


