This course is all about unlocking the true value of data, which is super important for us data analysts. In this course, it discussed KPI’s, metrics and we'll learn how to draw meaningful insights that can make a real difference in any company.
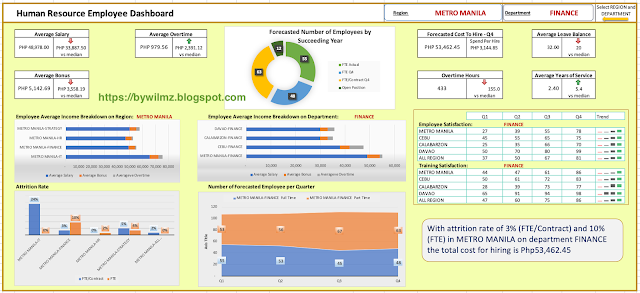
Now, I want to share my very first dashboard with you! As I started my journey of upskilling, I must admit, I learned a lot from my experiences. Looking back, I can now critique my own work, and it's kinda funny too. Haha!
Here are three important lessons I learned from my first dashboard:
1. Research on Color Palettes: I realized that choosing the right colors for the dashboard is crucial to make it visually appealing and easy to understand.
2. Tell a Story with KPIs: Instead of just showing raw numbers, I should focus on identifying related KPIs that can help me craft a compelling story or insight. That way, my data presentations will be more engaging and impactful.
3. Embrace Different Charts: I could have done it better if I learned about different charts, it's usage and explanation it is portraying.
As I recall, I didn't use any pivot table/chart in this dashboard. Even though I didn't use those in my very first dashboard, it was still a great starting point for me. I'm eager to enhance my skills and become more proficient in using various data visualization tools.
Well, that is my first and I am glad I do start. This skill is an additional package of what I am now and I am grateful to SPARTA for giving out this kind of FREE education for all.
If you want a copy of my Excel dashboard, feel free to drop us a message on our Facebook Page. Keep learning and enjoy your data analytics journey! Happy Learning!

